


Project Overview
I led the development of a feature-rich analytical dashboard utilizing Flask for the backend and React.js for the frontend. The dashboard incorporates real-time charting, dynamic filtering, and axis toggling capabilities. Redux was employed for state management, while Tailwind CSS was used for sleek styling. React Chart.js and Chart.js were integrated for advanced charting functionalities. Form validation was ensured with Formik and Yup, enhancing data accuracy and usability. MongoDB served as the database, providing a robust and scalable data storage solution.
Key Highlights:
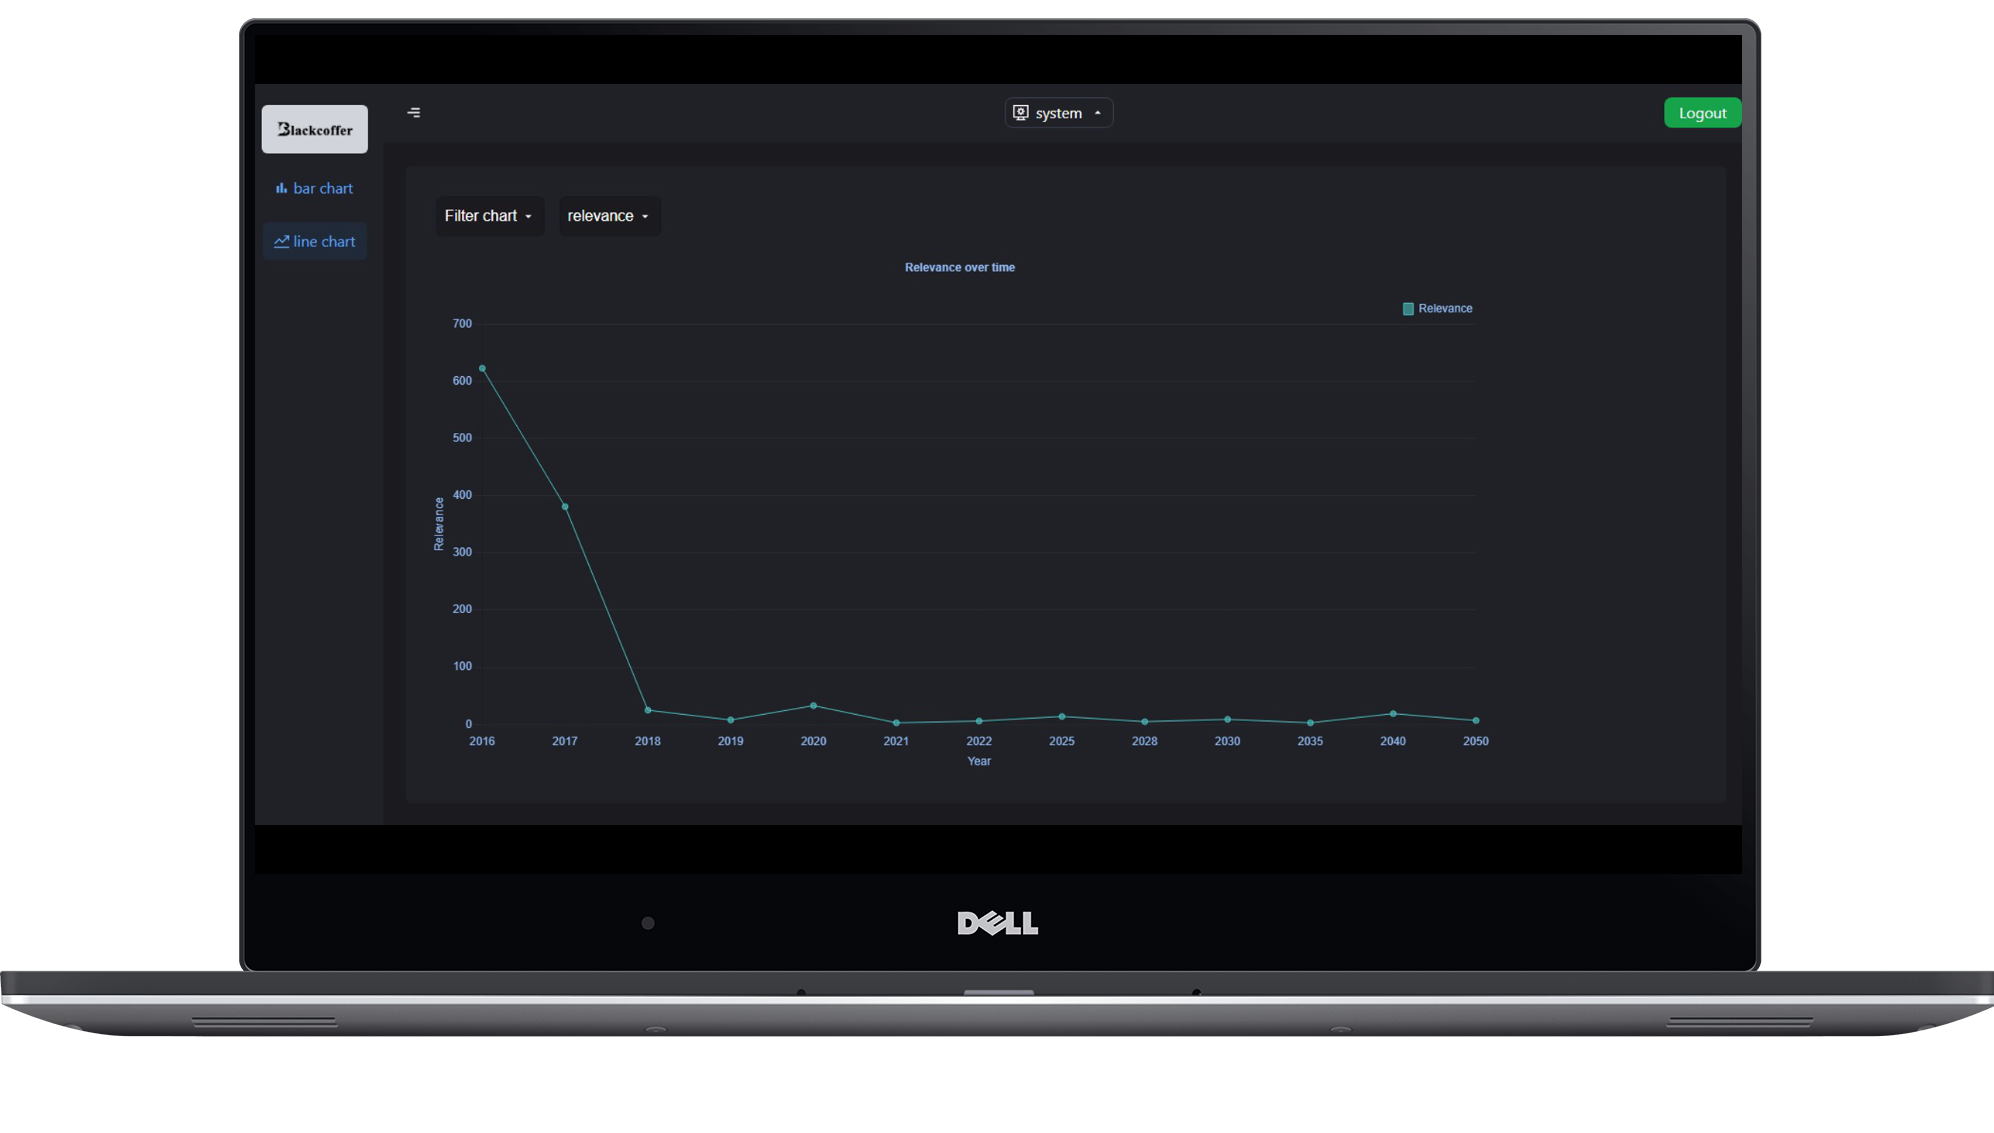
Real-Time Data Visualization: The dashboard features dynamic and interactive charts that update in real-time based on user interactions.
Flexible Filtering: Users can apply filters to manipulate data visualization, enhancing the dashboard's usability and flexibility.
State Management with Redux: Redux facilitates efficient state management, ensuring seamless updates across components.
Stylish UI with Tailwind CSS: Tailwind CSS was utilized for a modern and responsive user interface design.
Advanced Charting with React Chart.js and Chart.js: Leveraging React Chart.js and Chart.js libraries for powerful and customizable charting capabilities.
Form Validation with Formik and Yup: Formik and Yup were integrated to ensure robust form validation, enhancing data accuracy and user experience.